Experimental designs
Wine4cast leverages diverse technologies to generate predictions/forecasts tailored to different spatial scales, addressing the specific needs of stakeholders in the wine industry. The project evaluates these technologies based on their maturity, operational feasibility, cost-effectiveness, accuracy, and ability to provide timely insights ahead of the harvest.
Ultra-early Forecasting
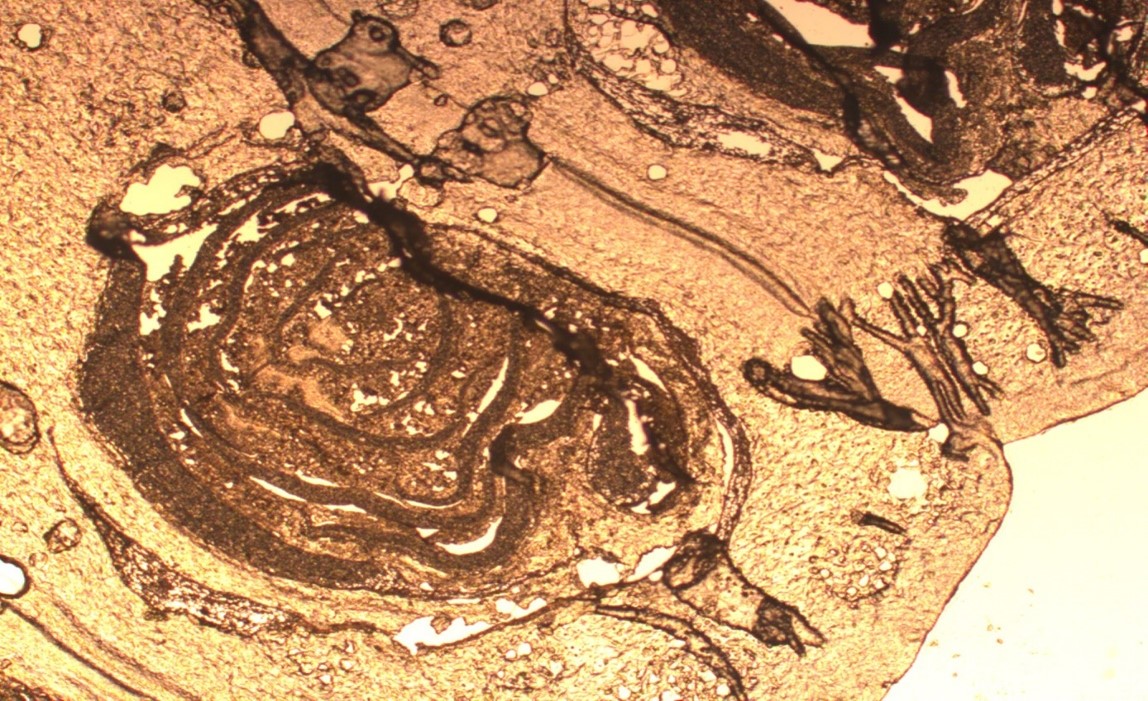
Dissection and analysis of buds
The main objective of this activity was to assess the fertility of the dormant bud of the grapevine using optical microscopy. This information is used to validate the spectral analysis to be carried out by different sensors for non-destructive evaluation of the fertility of dormant buds.
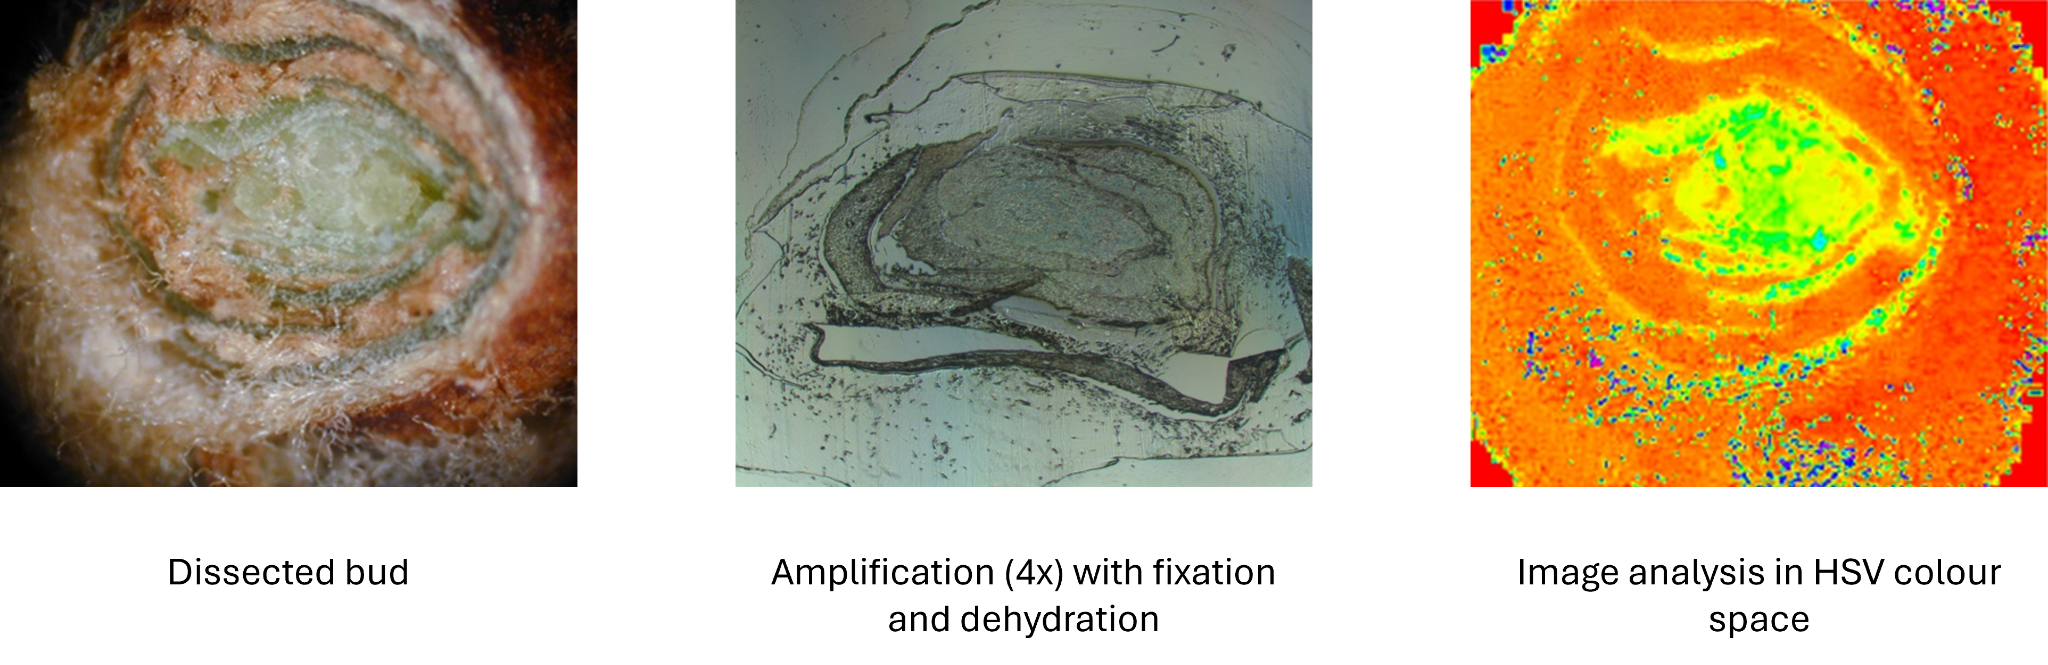
Experimental Design:
2023
Centro de Estudos Vitivinícolas do Dão (CCDRC), Pólo de Inovação de Nelas, Viseu
2 (Types of buds) x 2 (Types of vigour) x 10 (No. Vines) x 8 (No. Buds) = 320 buds
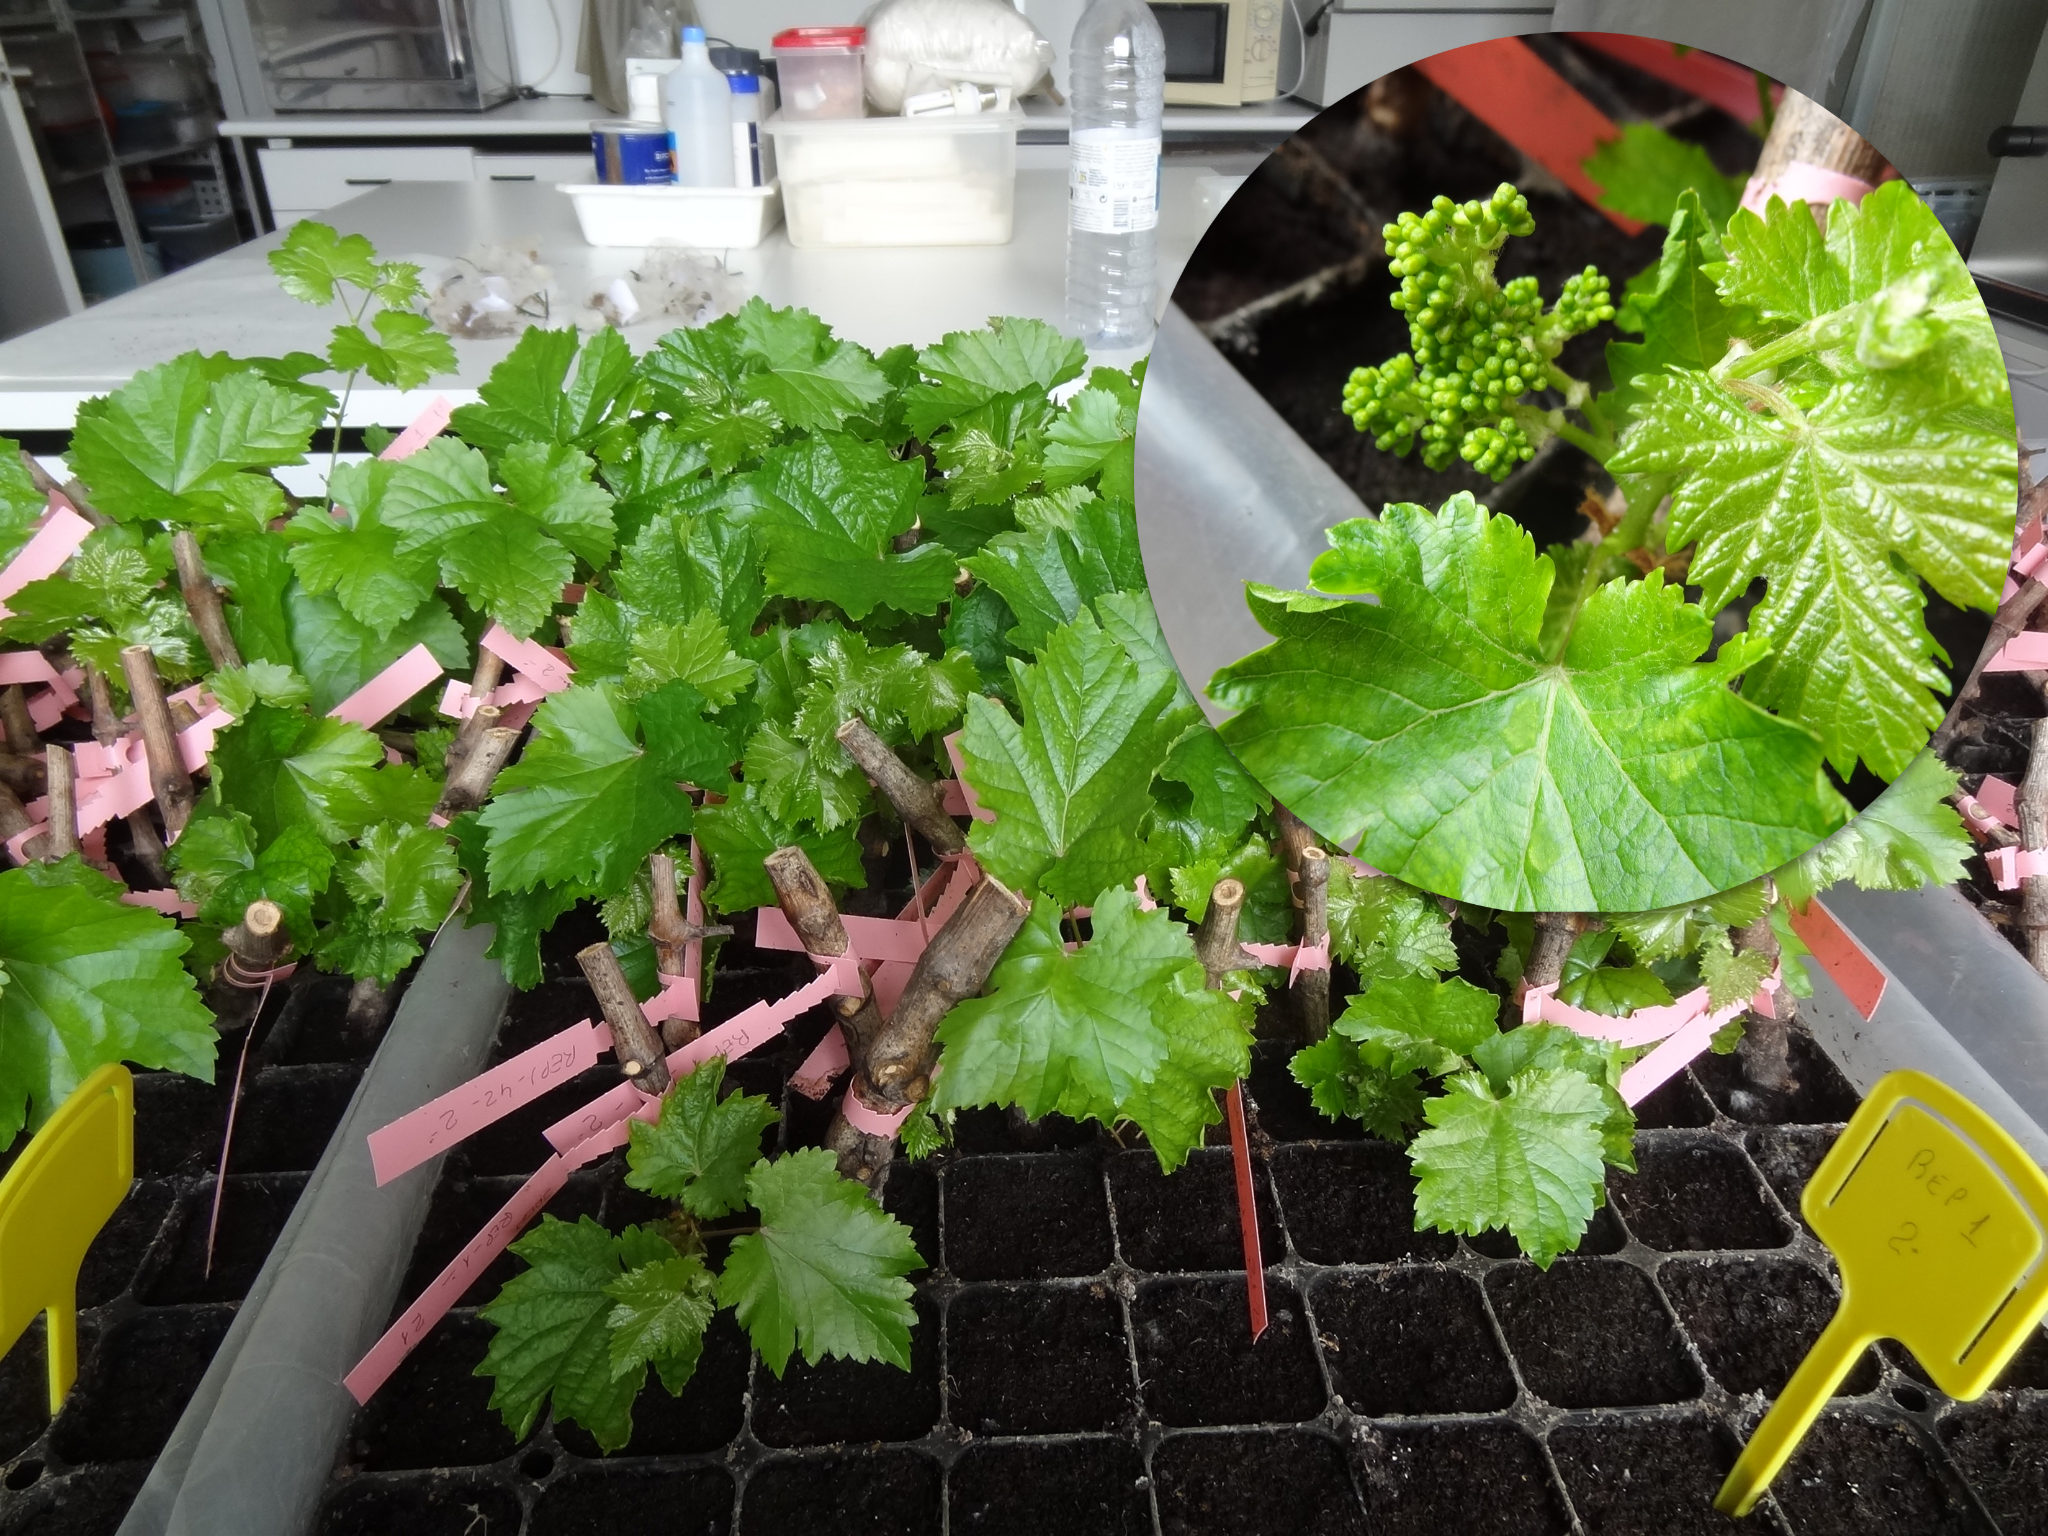
Forcing bud growth
The main aim of this study is to validate the forcing bud growth technique to measure fertility potential, as an ultra-early method of grapevine yield assessment. This information can also be used to validate the spectral analysis to be carried out by different sensors for non-destructive evaluation of the fertility of dormant buds.
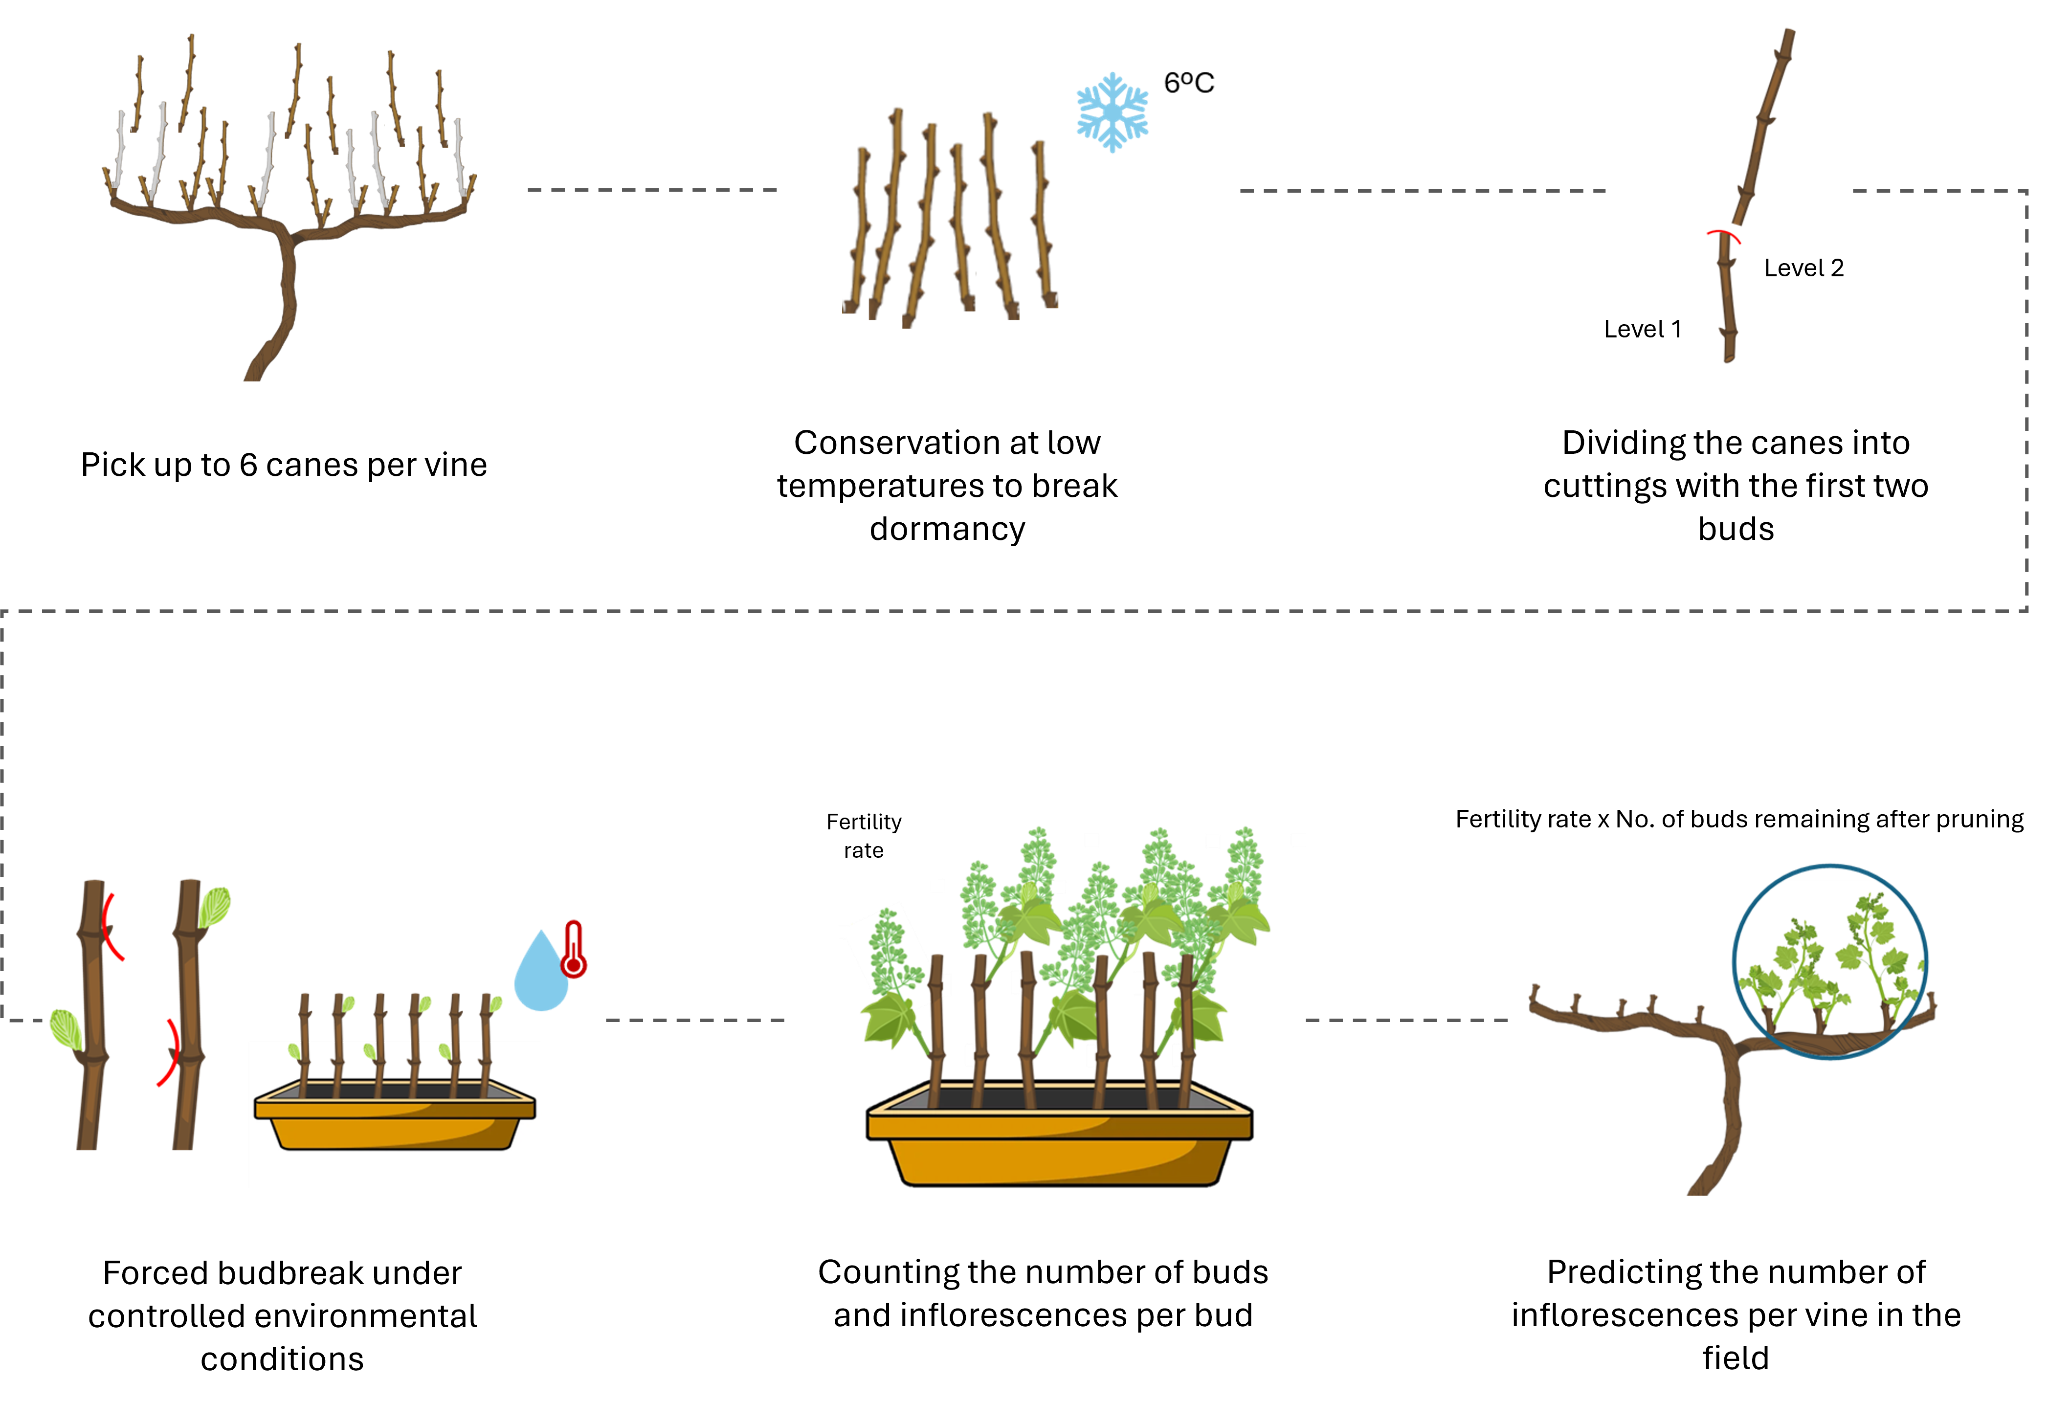
Experimental Design:
2023 and 2024
Centro de Estudos Vitivinícolas do Dão (CCDRC), Pólo de Inovação de Nelas, Viseu
4 blocks x 3 rows x 3 spaces x 6 vines = 216 vines
In-cycle Forecasting
Grapevine Phenotyping
Monitoring yield components using visual and digital phenotyping approaches throughout the different phenological stages of the vine.
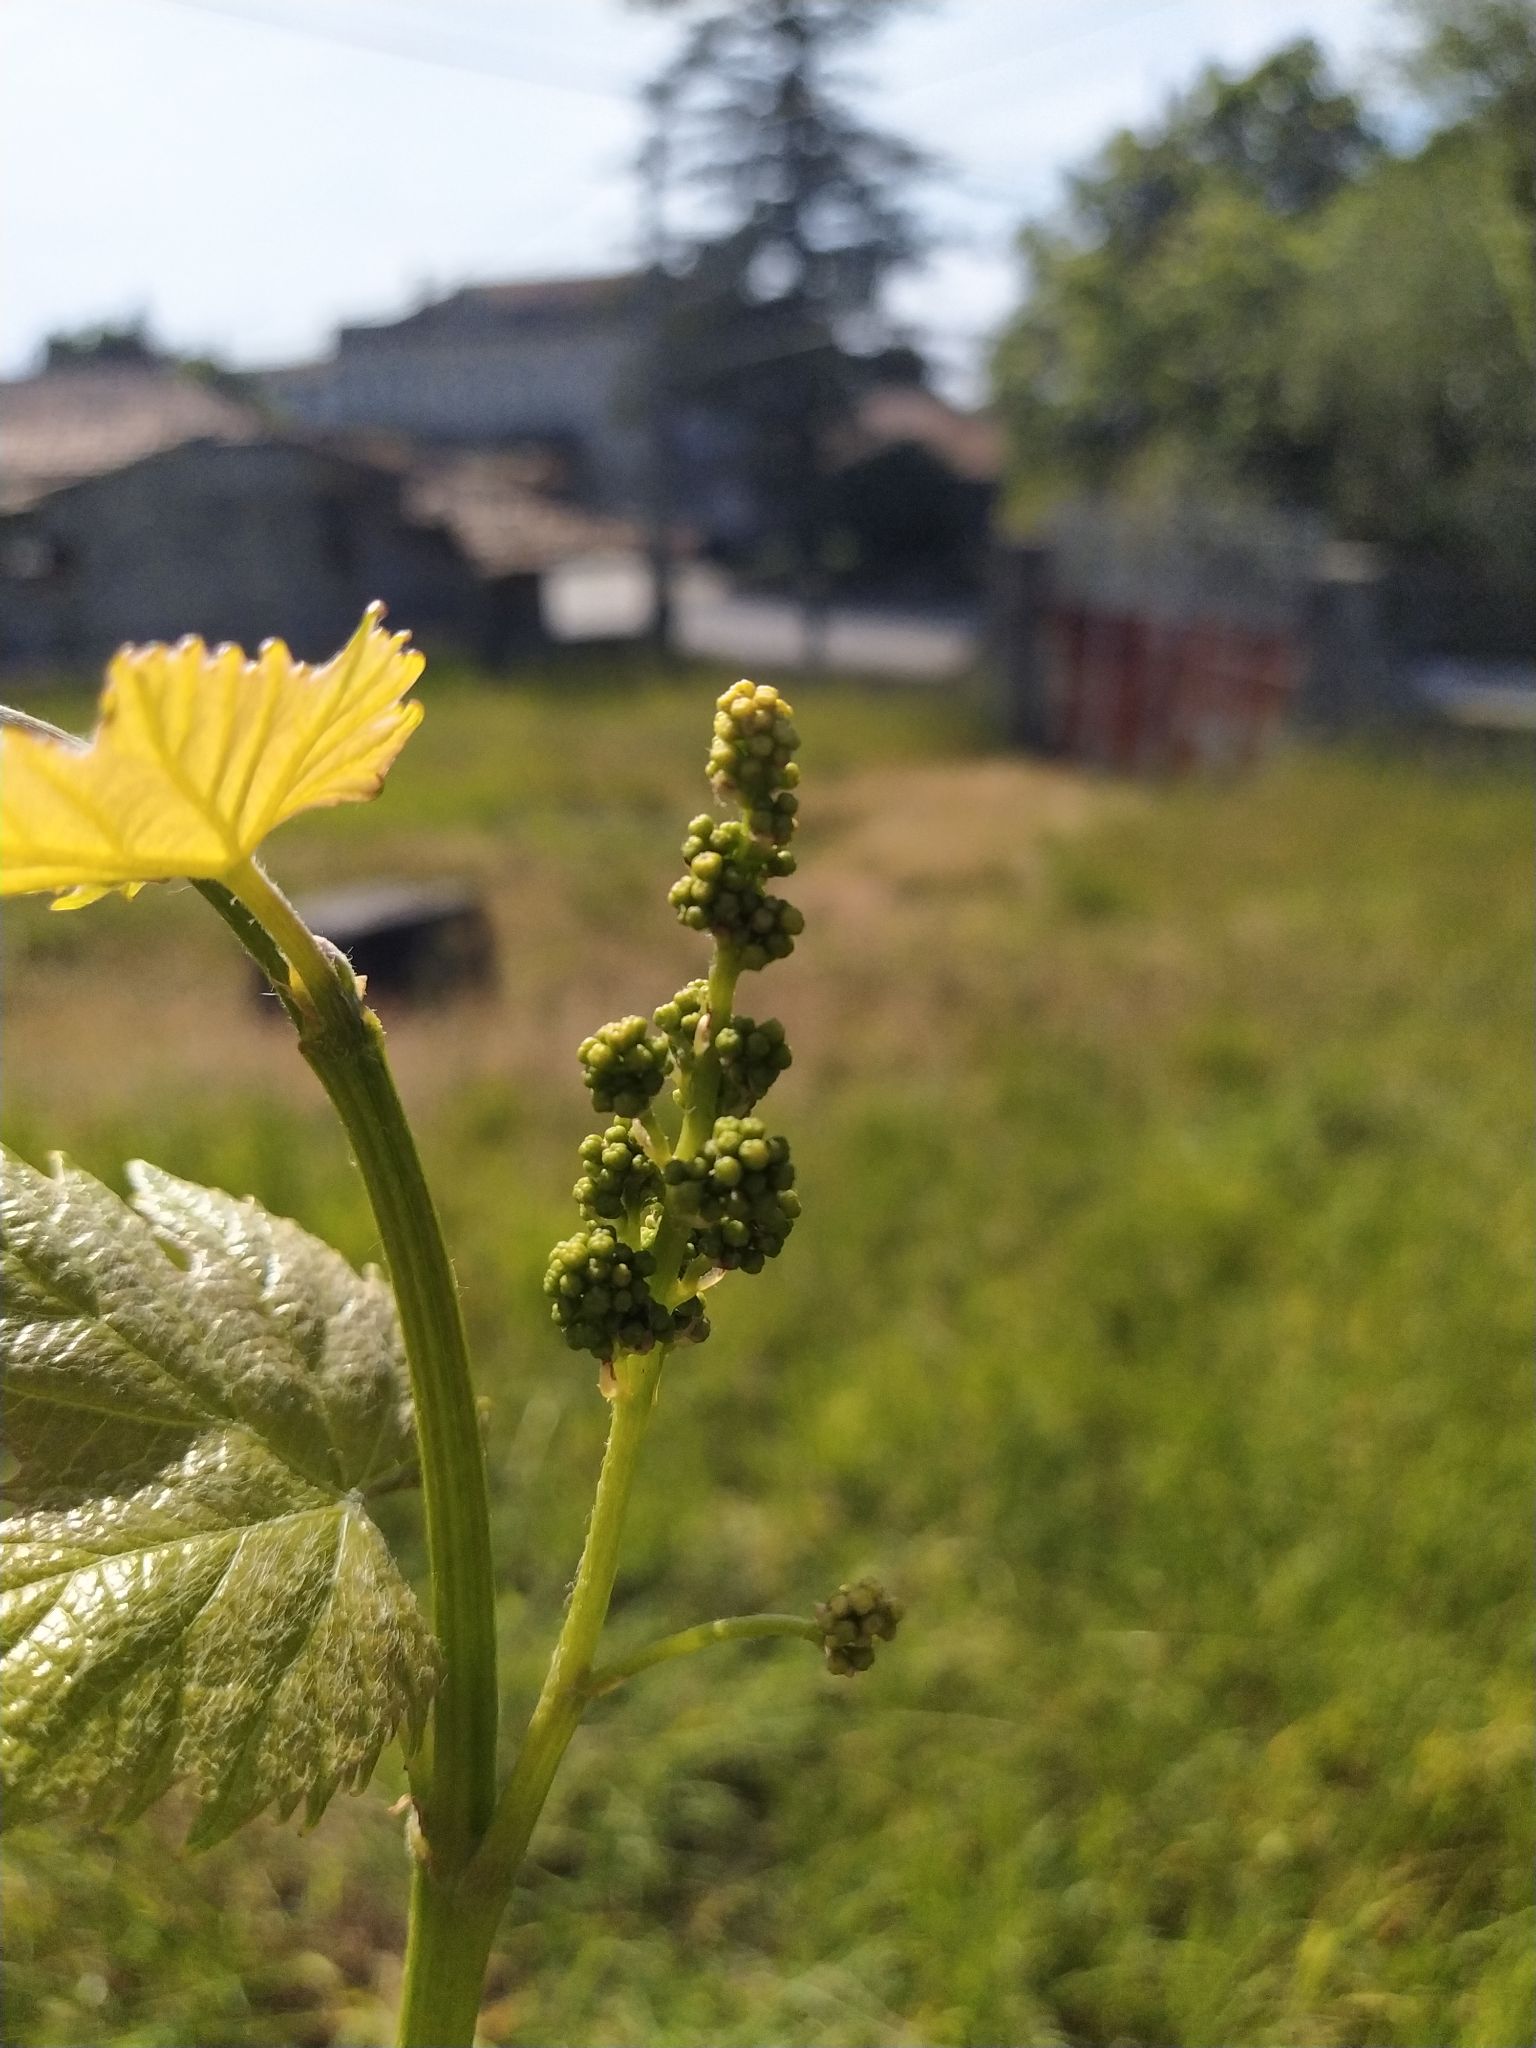
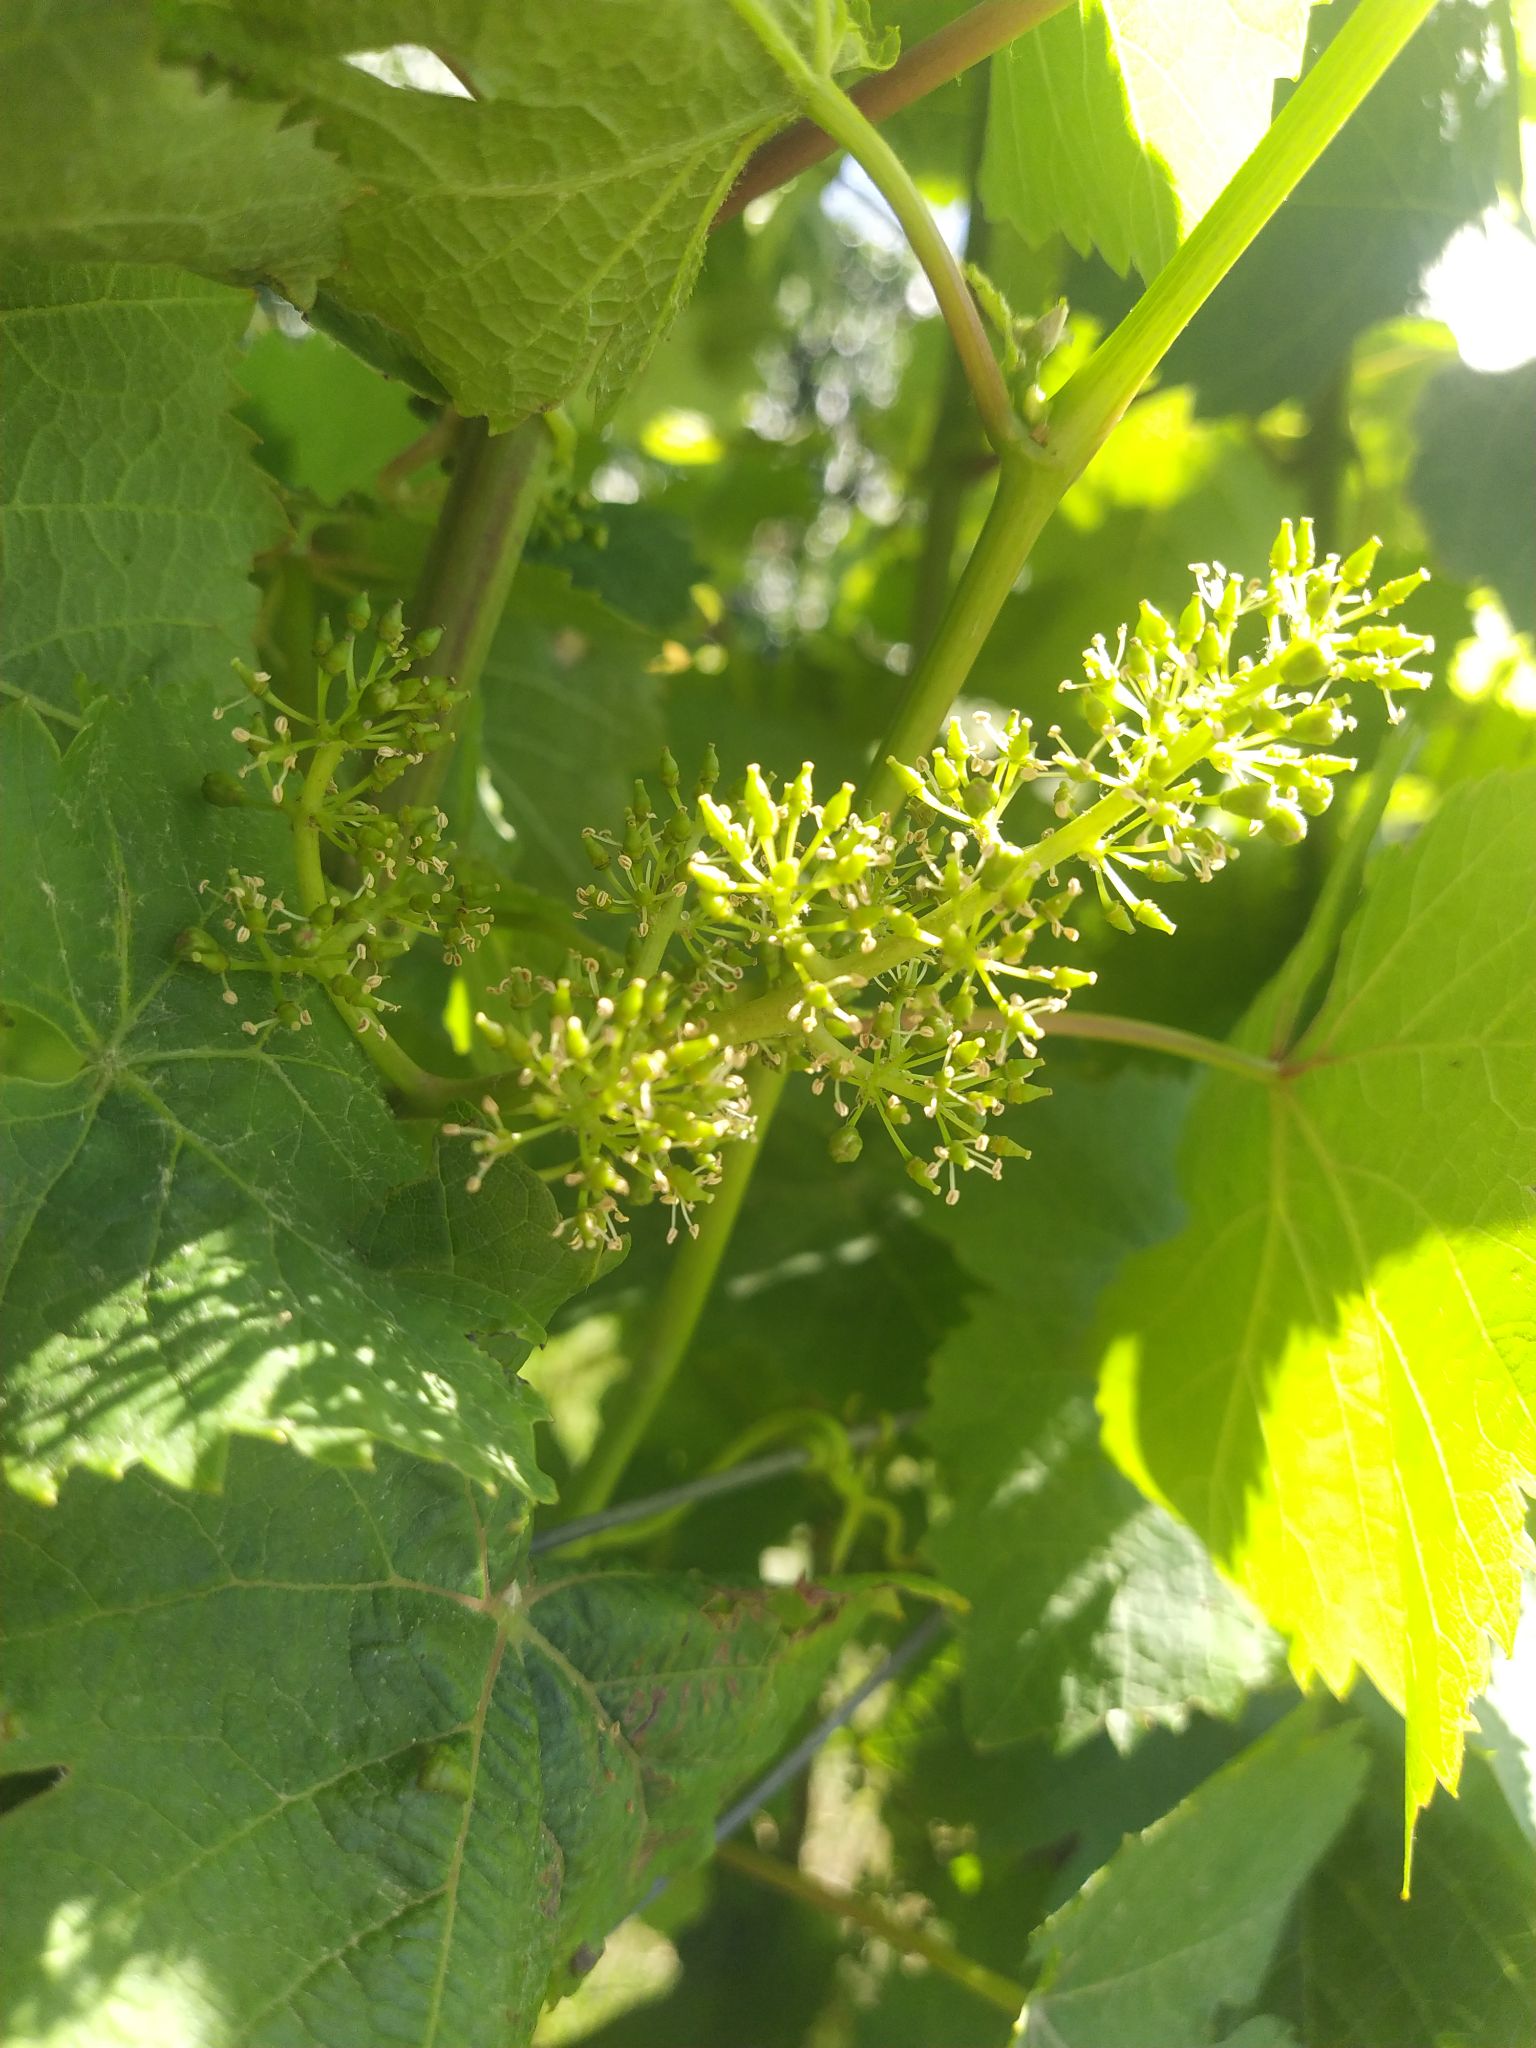
Flowering
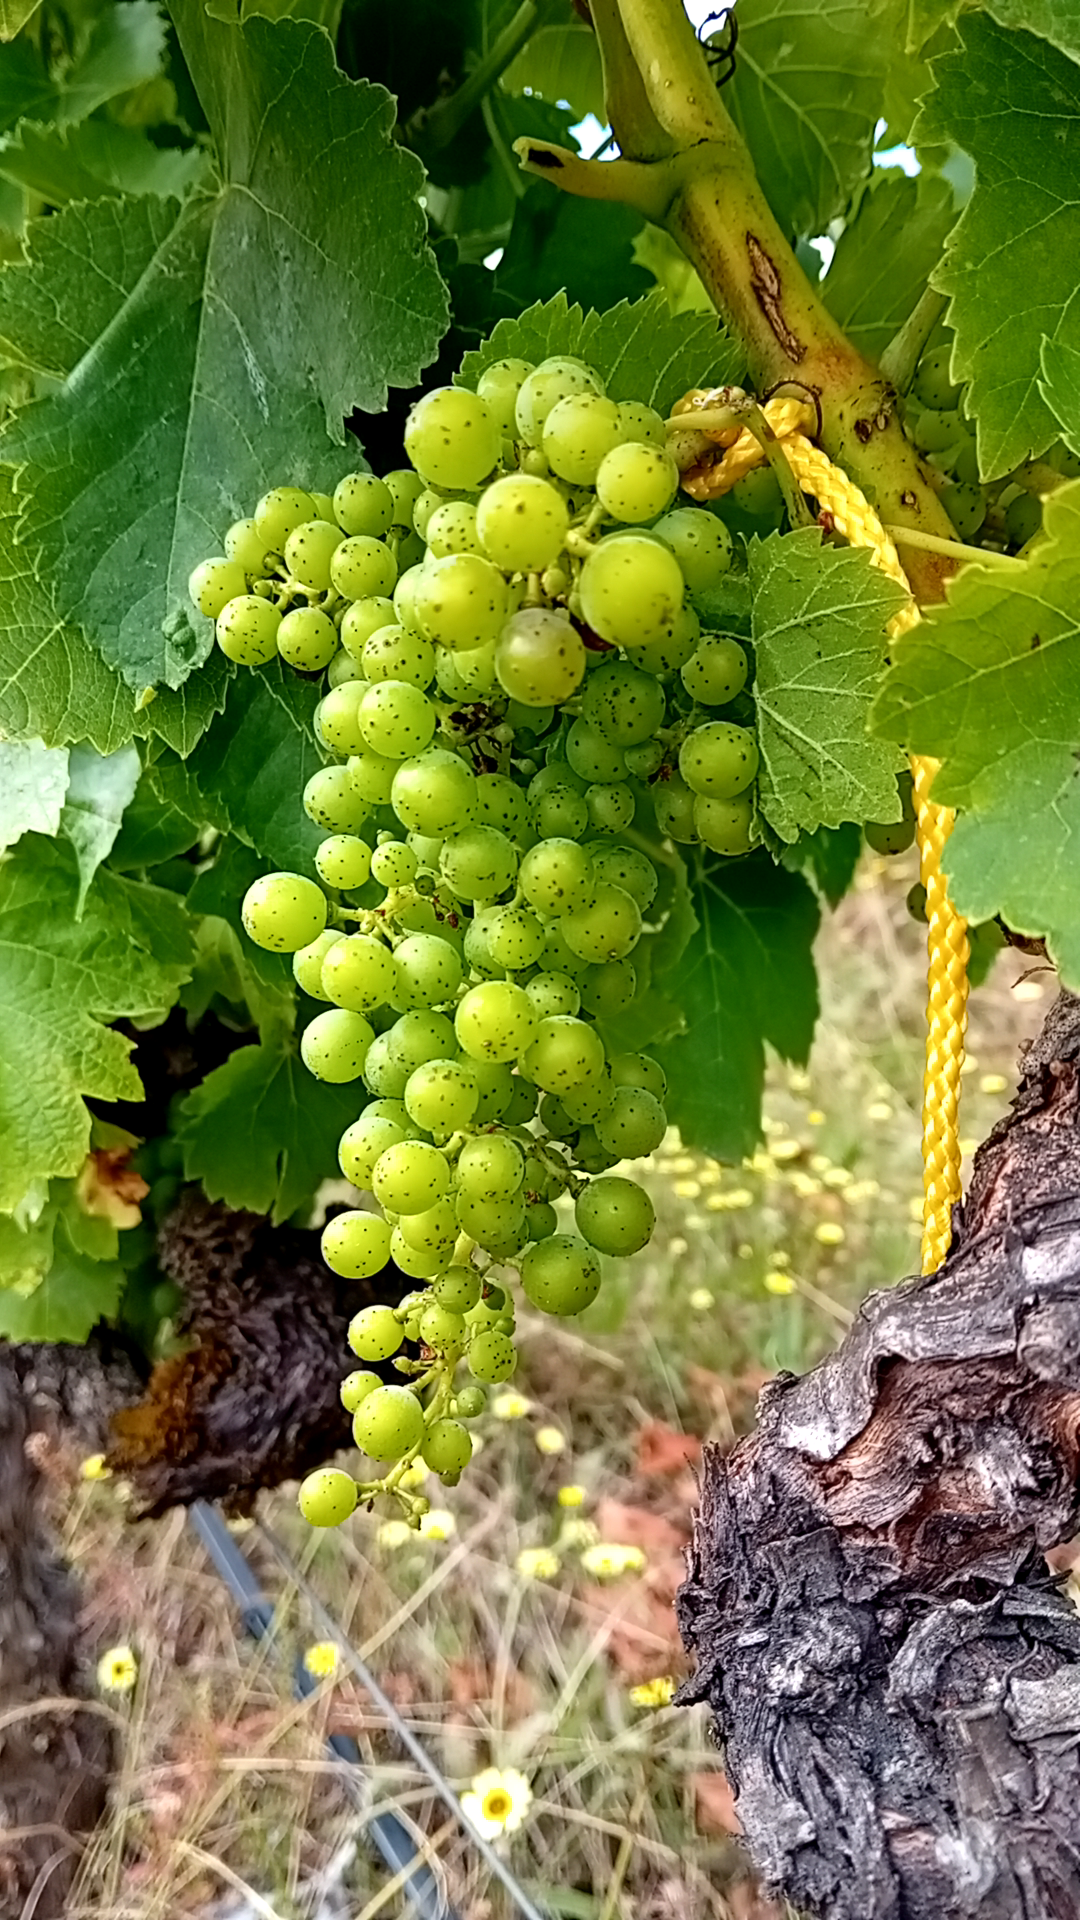
Fruit-set
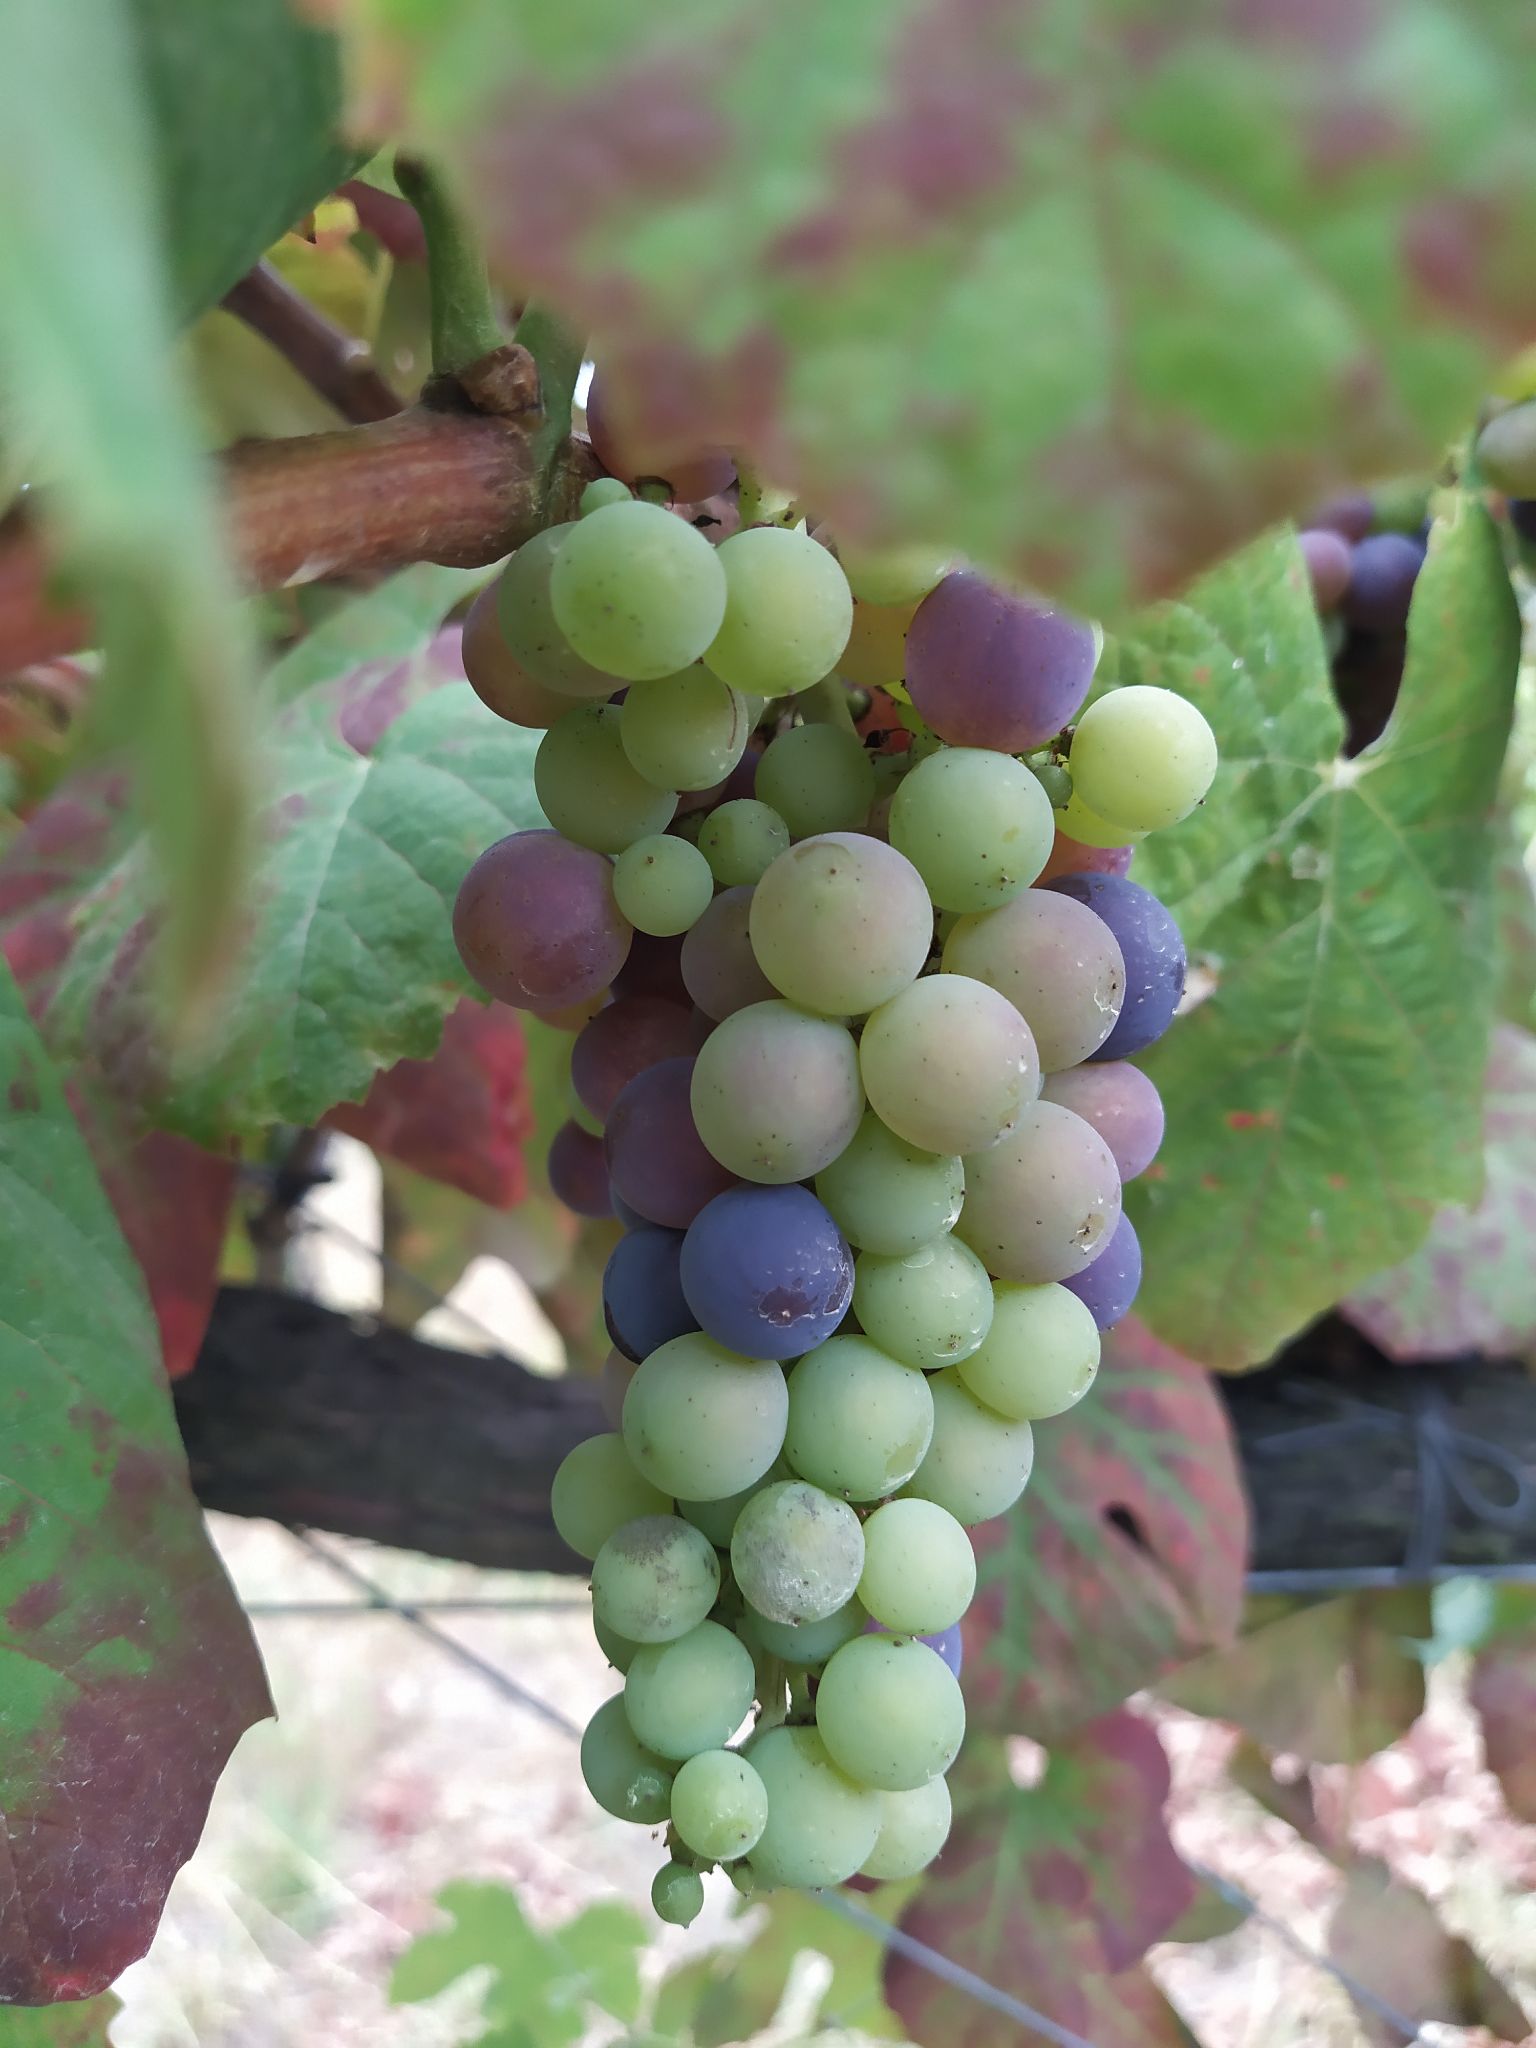
Veraison
Harvest
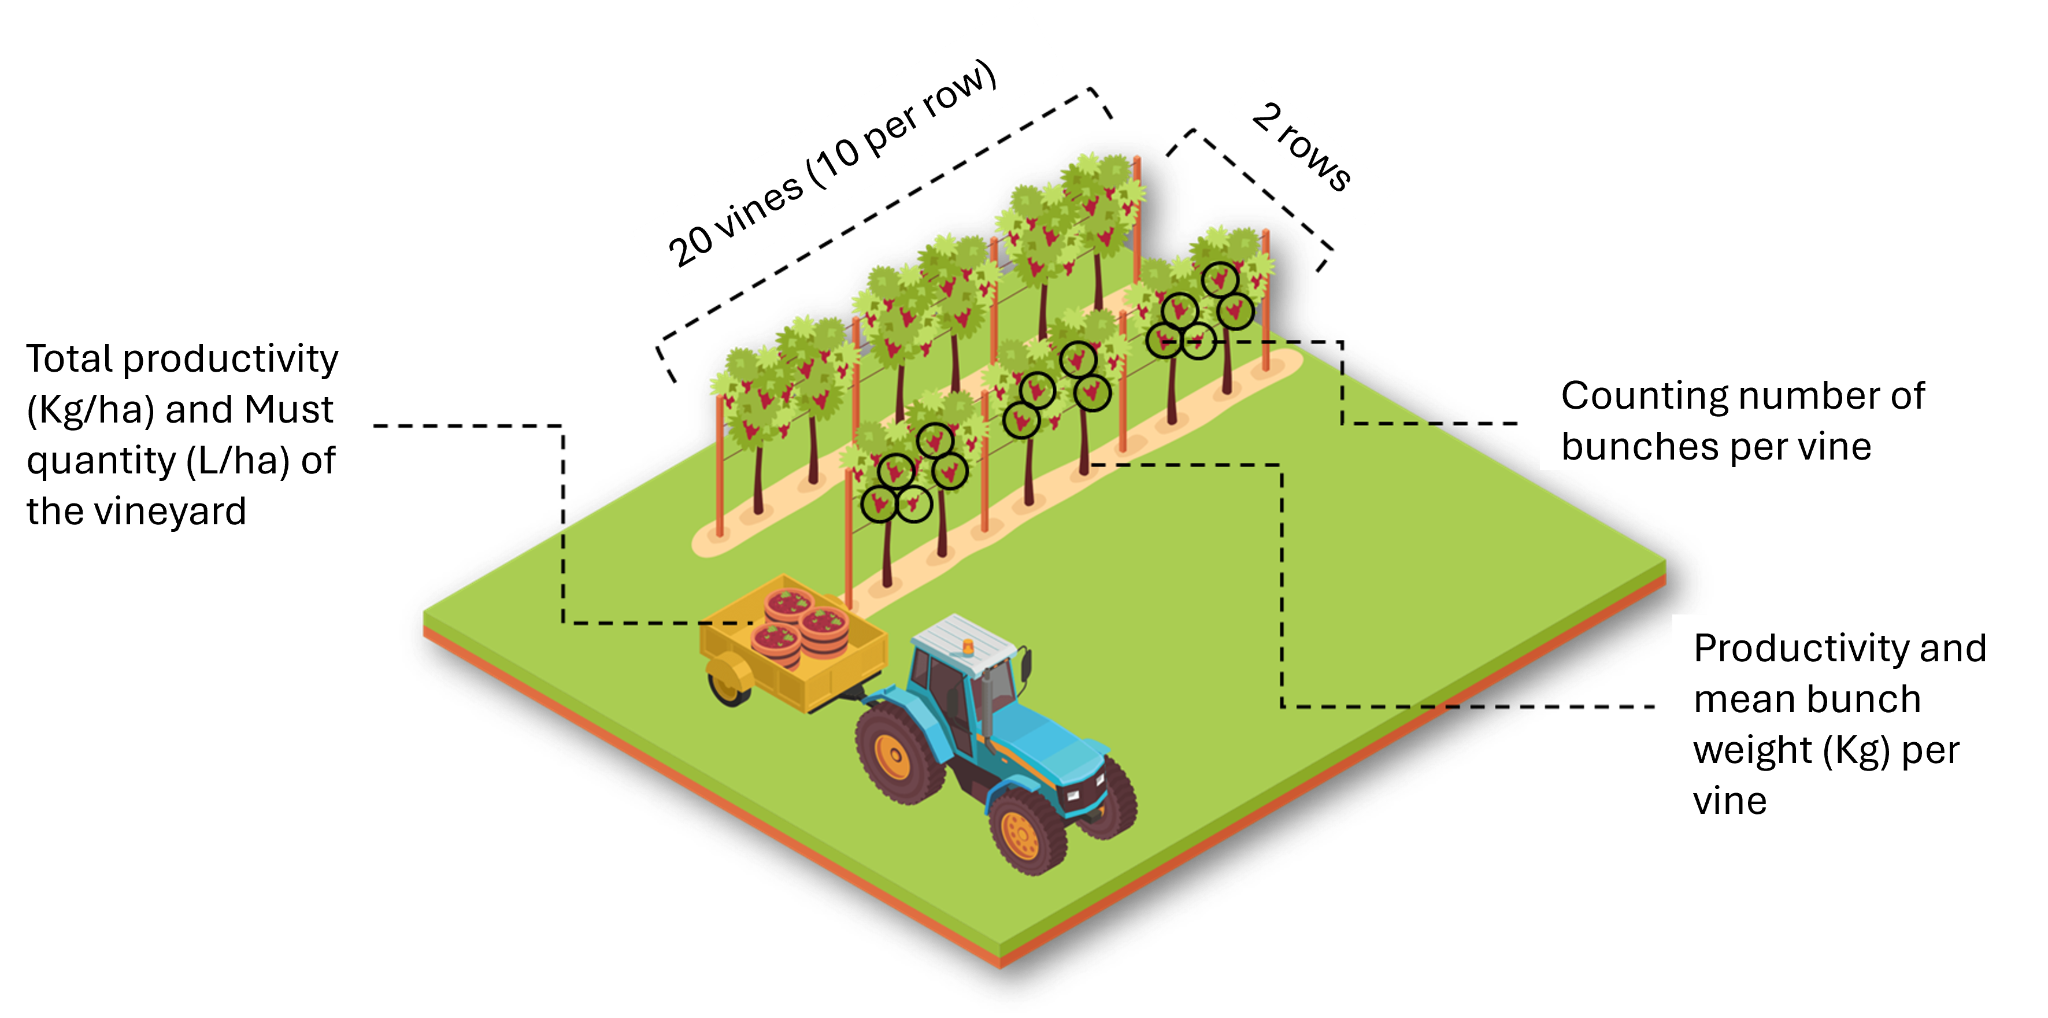
Visual Phenotyping
Selection of 2 rows in the reference vineyard
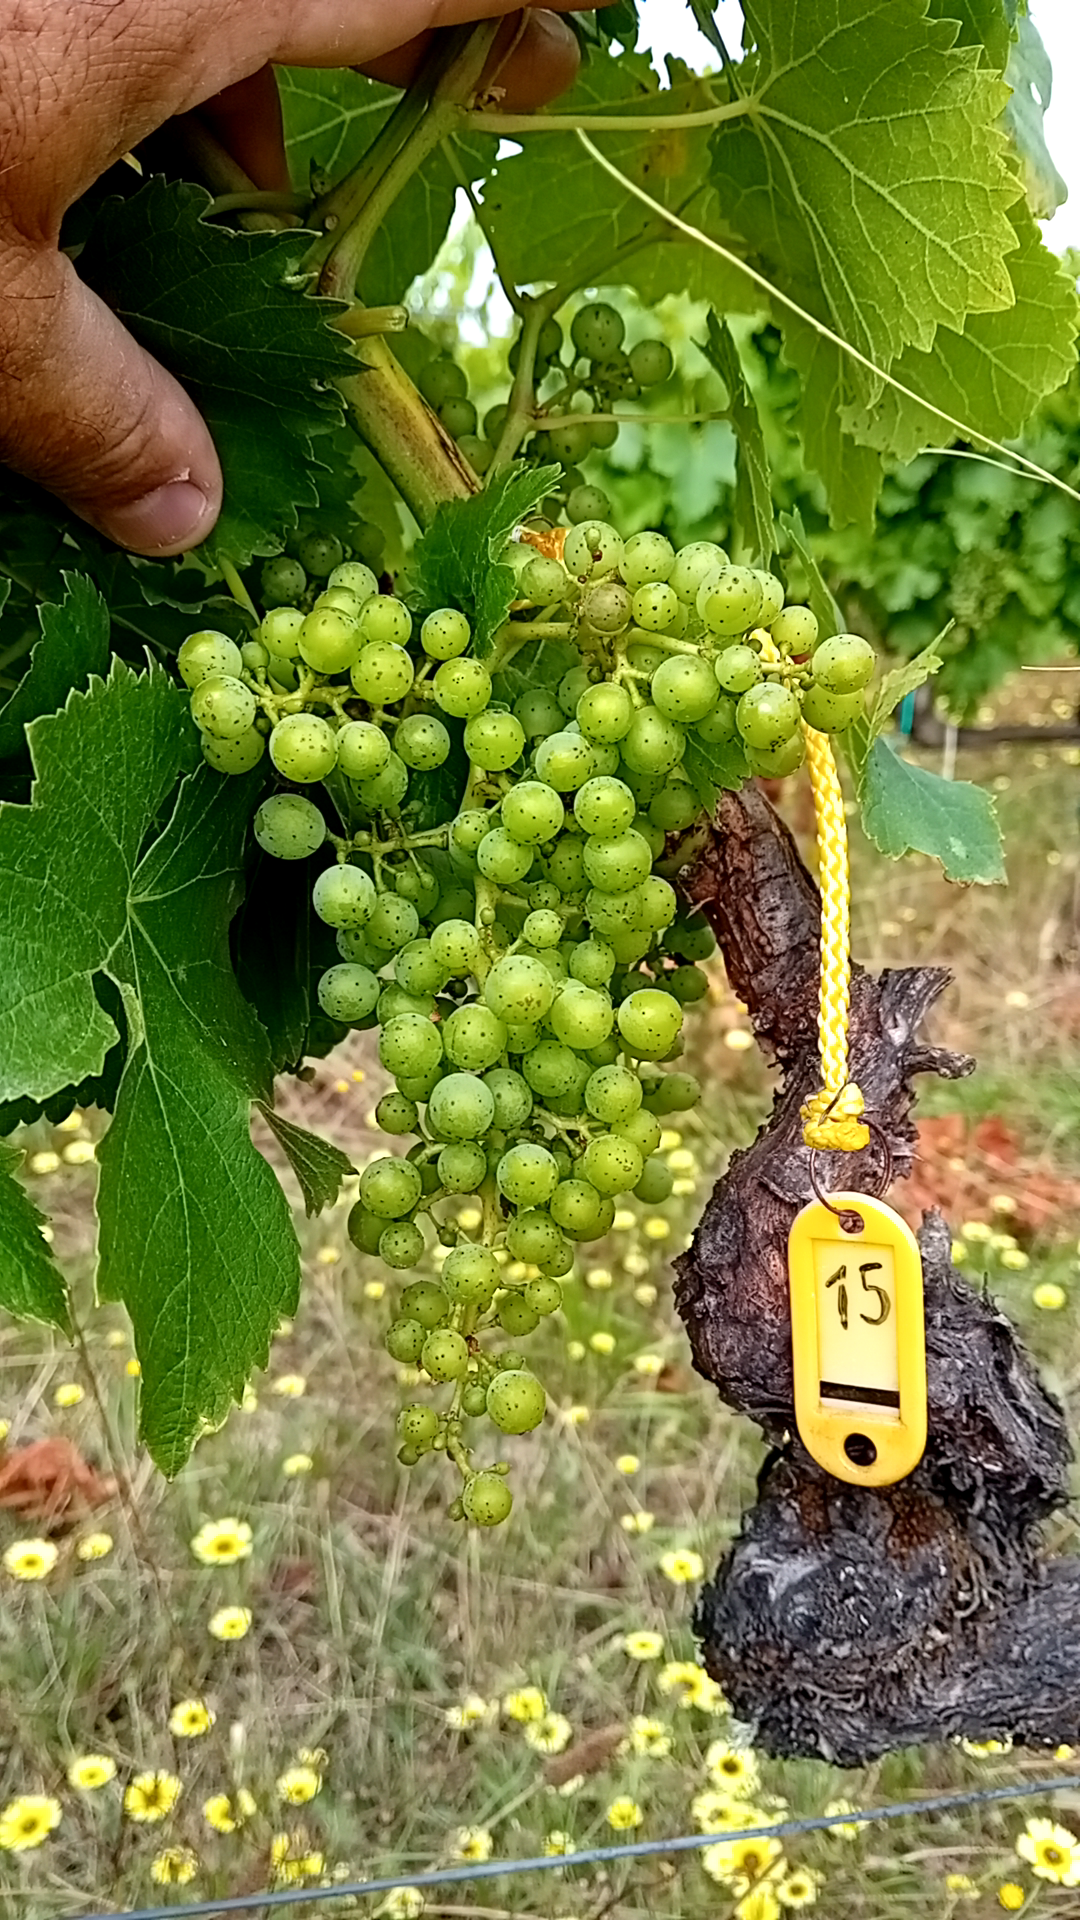
Labelling of a total of 20 non-consecutive vines (10 per row) (min. 1 vine interval)
Assigning a unique ID to each vine
Registration of the number of inflorescences or bunches on each vine sampled, throughout the different phenological stages
Registration of the total yield of each vine and the average bunch weight (Kg) at harvest
Registration of the total productivity of the vineyard (Kg/ha) and the quantity of must (L/ha) at harvest
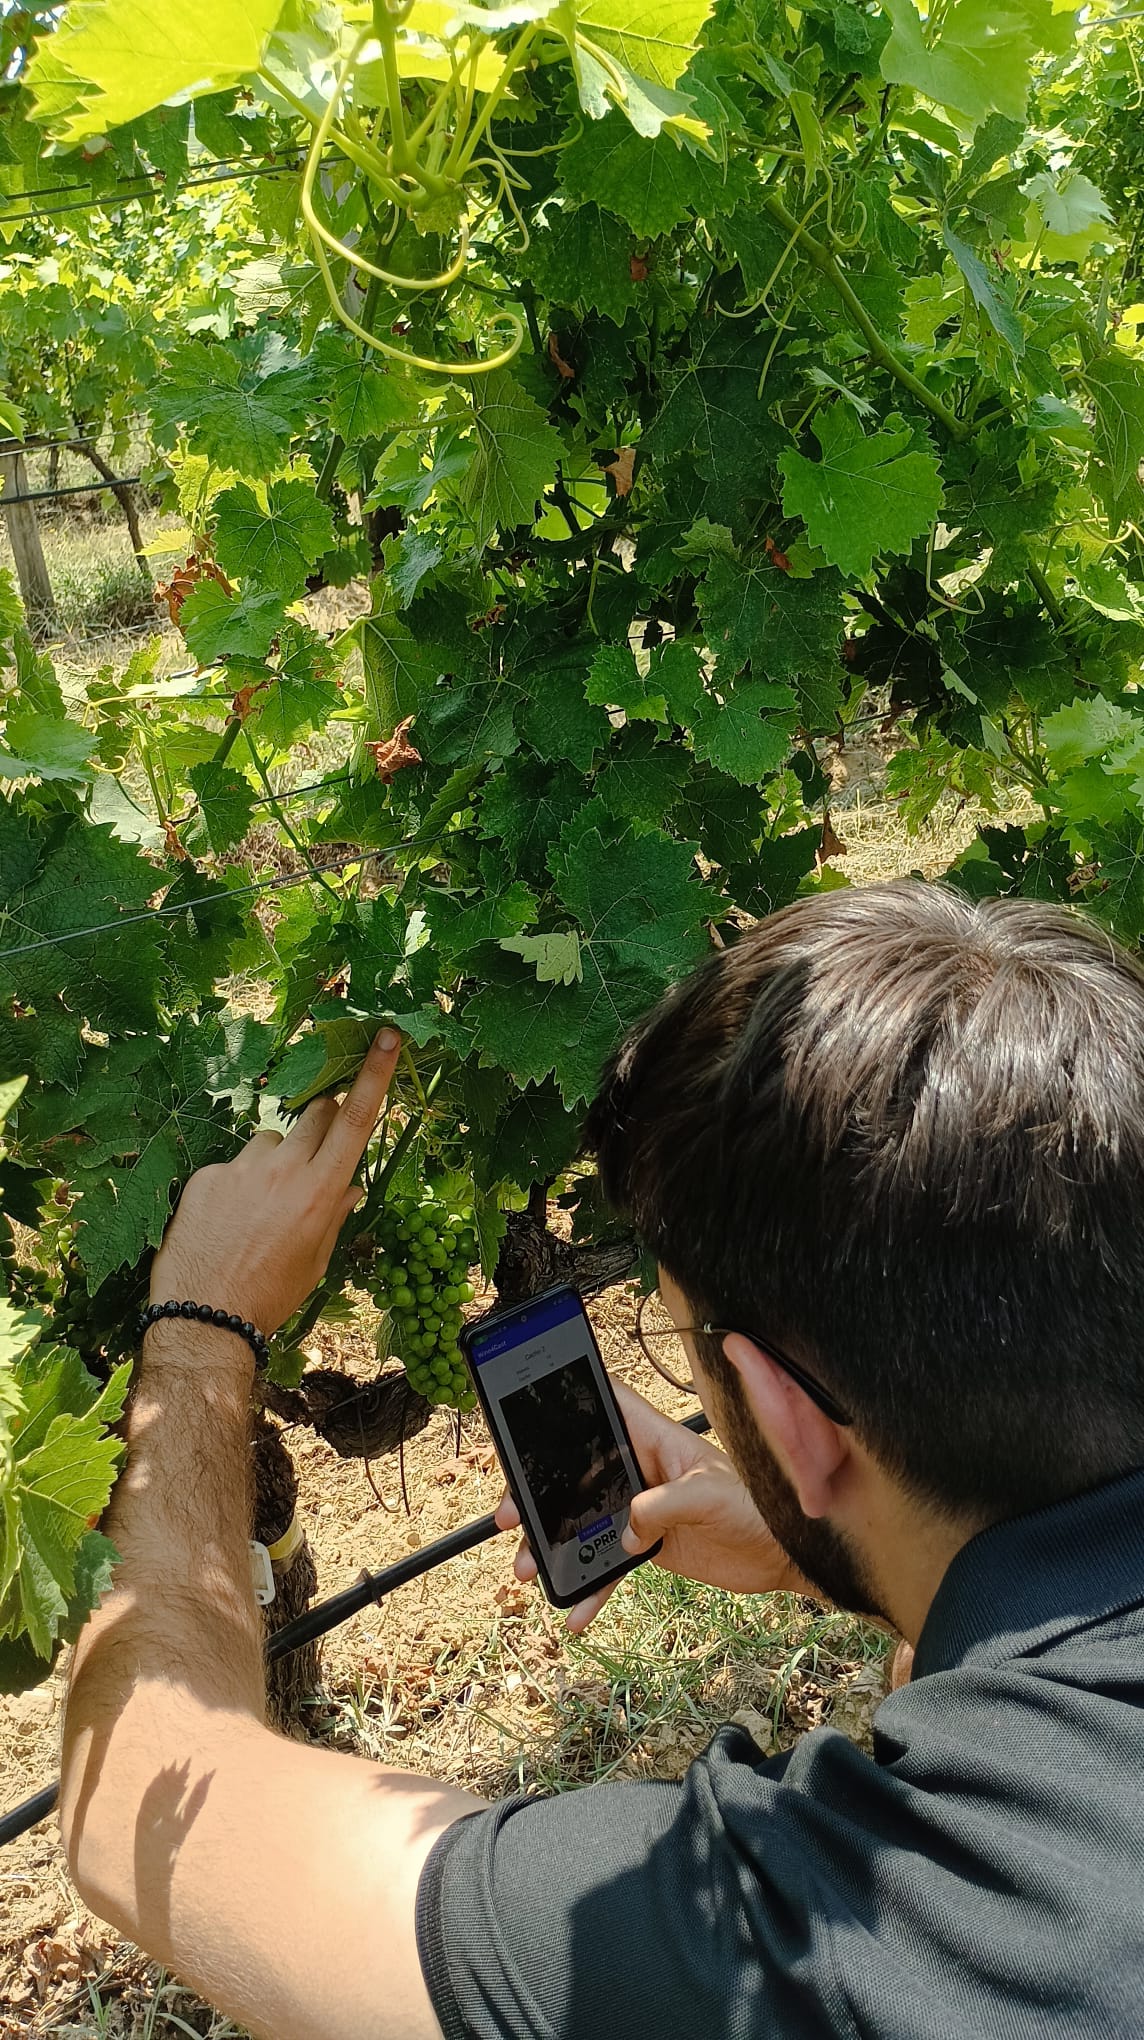
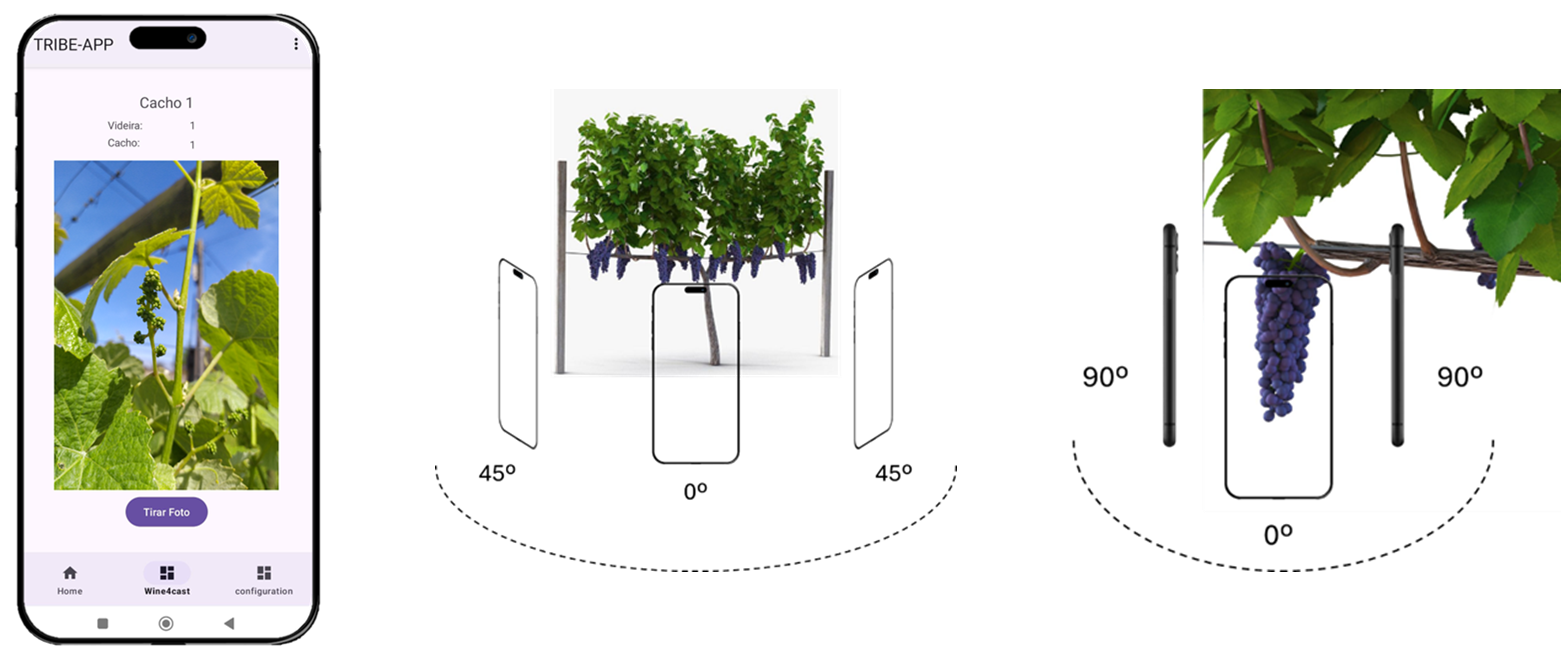
Digital Phenotyping
Wine4cast Android App
Acquisition of geo-referenced RGB images of yield components
Taking images of one side of each vine sampled, from 3 different perspectives.
Selecting and collecting images of 1 bunch per vine, from 3 different perspectives.
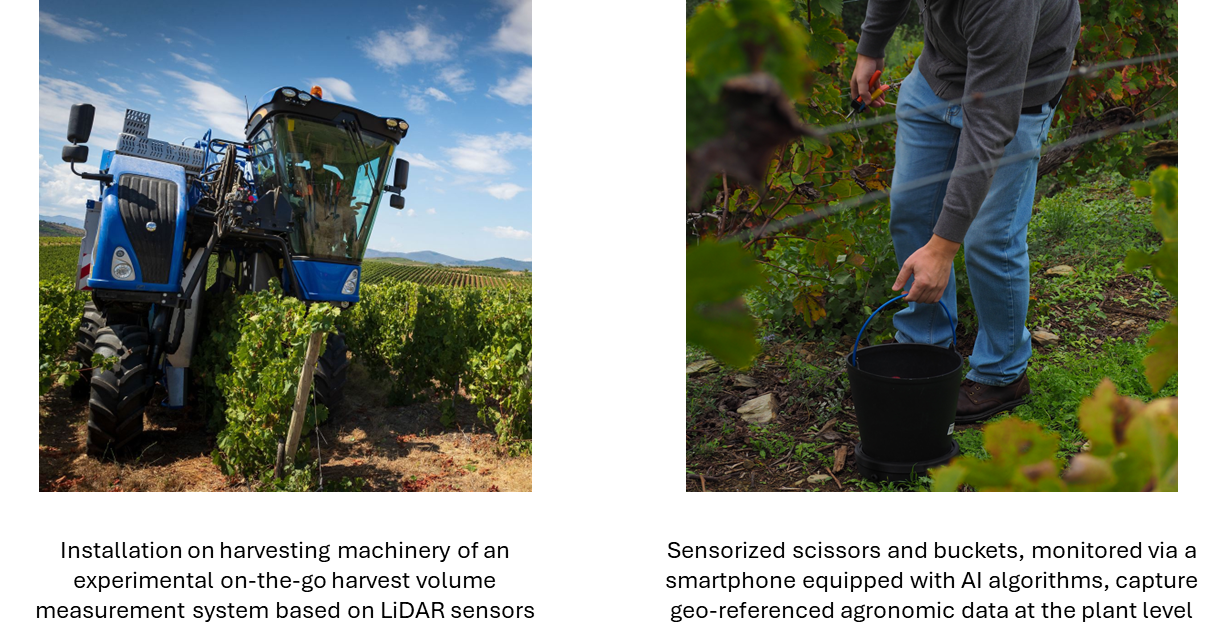
Yield Productivity Maps
These systems provide detailed insights into harvest productivity and quality, while offering essential management indicators to optimize the agronomic process based on:
Harvest machinery
SharpMetrix®
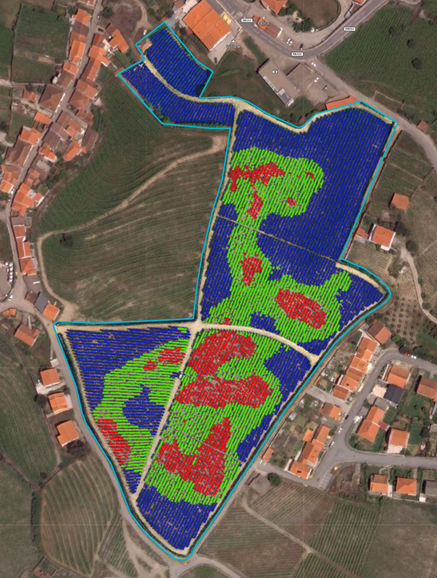
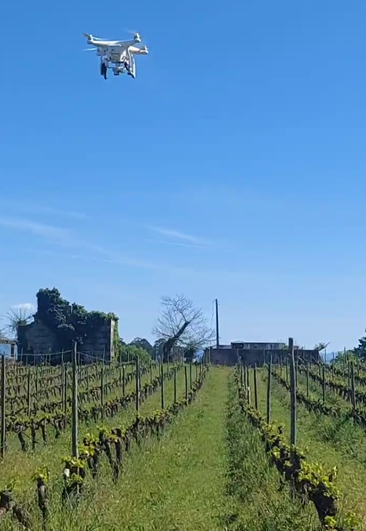
Remote Sensing
The use of drones as part of the project is initially divided into two objectives:
Obtaining indicators of vigour at plant level.
Early detection of inflorescences at the flowering stage.
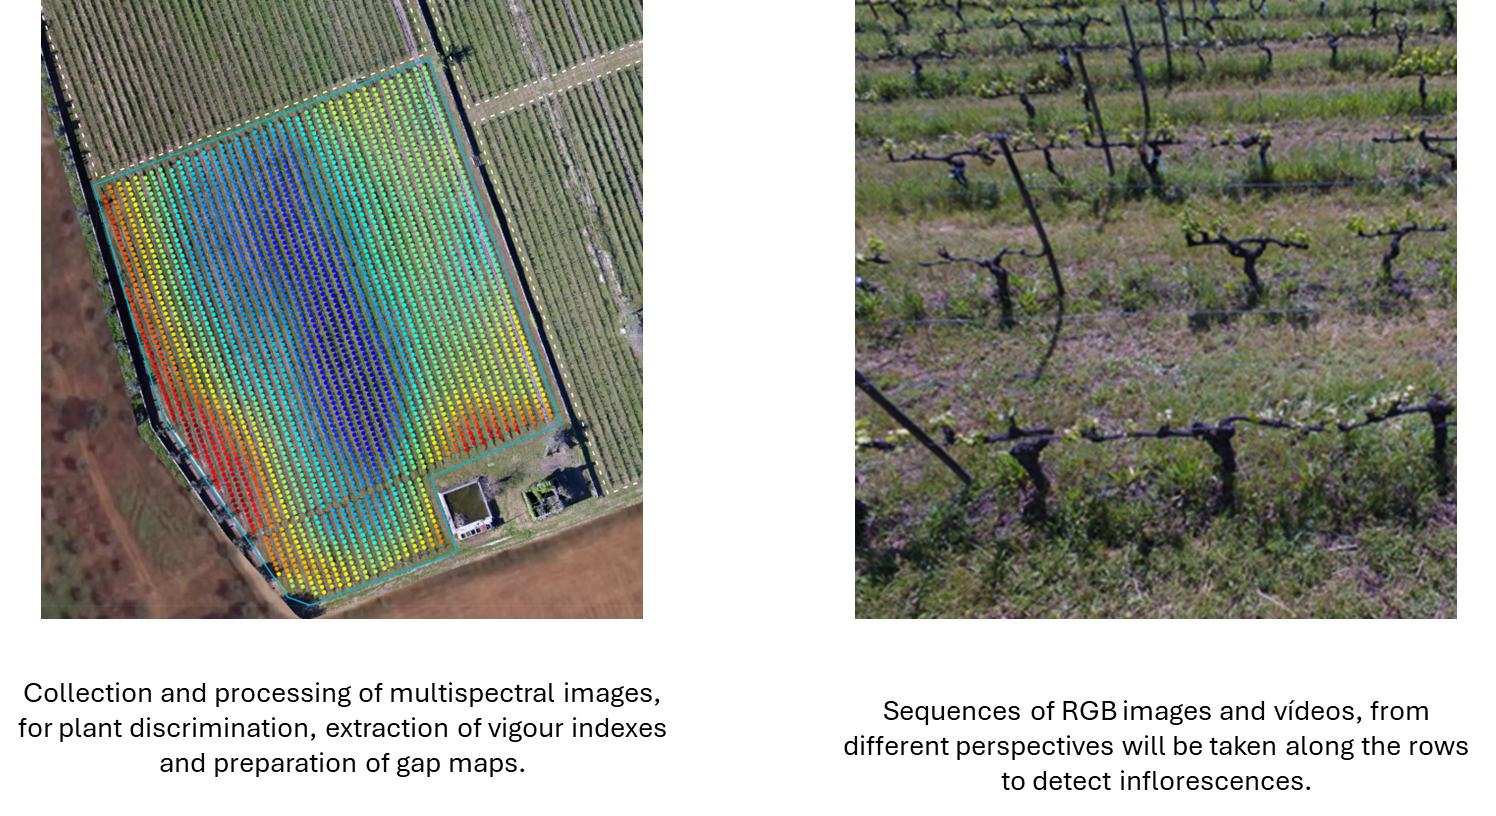
All the outcomes of this action will be made available on the MAPP.it application
Regional Level Forecasting
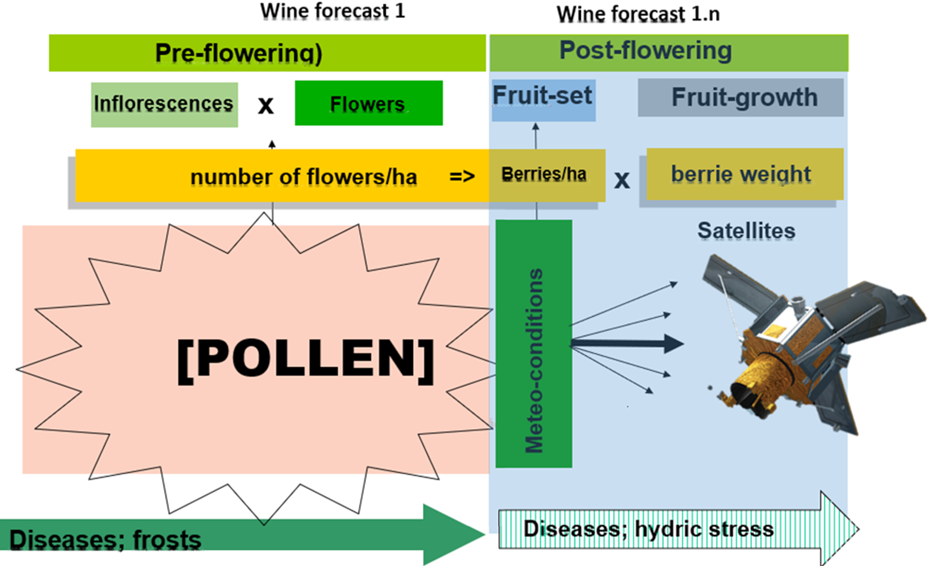
Airborne Pollen
Regional wine forecast based on a hierarchical analysis, including the estimation of the potential productivity by quantifying airborne pollen at flowering, followed by the evaluation of the possible impact of post-flowering (a)biotic conditions based on remote sensing data.
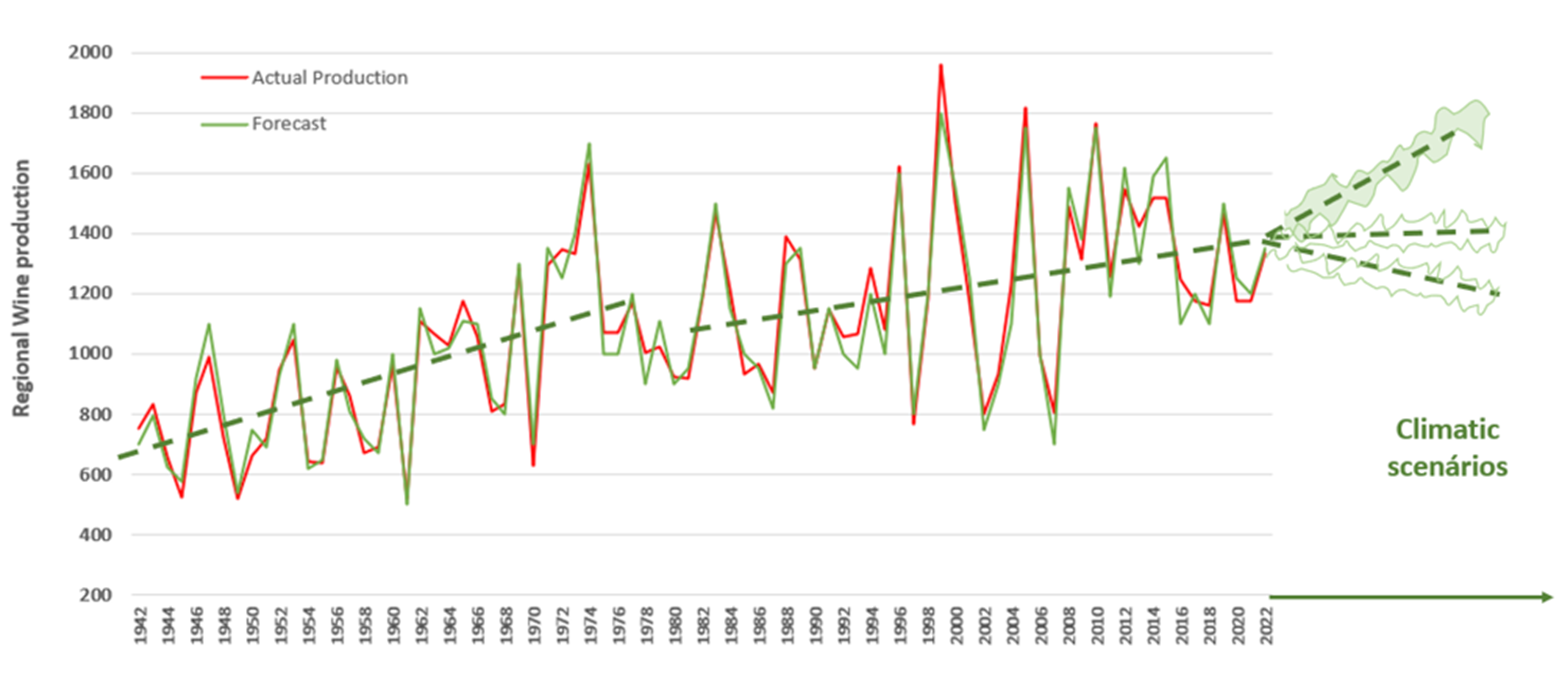
Long-term Projection
Time series analysis approaches (>100 years) to identify the cyclical properties of regional productivity determined by climate and the likelihood of different productivity levels deemed relevant to the sector. This projection is crucial for the sector, particularly for its planning and risk assessment related to productivity variability, including climate scenario considerations.